Category Archives: Web Intelligence

BusinessObjects Web Intelligence

Weird issue in Webi

A query is based on eFashion universe and returns two objects: measure [Promotion Cost USD] and dimension [Duration].

The variable [Cost] is defined as

=If [Duration]>0 Then [Promotion Cost USD]/[Duration]

The following formula in report’s cell returns #MULTIVALUE

=Sum([Cost])

If I just replace the variable with the expression, it will return correct value

=Sum(If [Duration]>0 Then [Promotion Cost USD]/[Duration])

The following formula also returns correct value

=Sum([Cost] ForEach([Duration]))

context issue

Calculation contexts issue with Sum, Where and If

Make a report based on eFashion universe with [Year], [City], and [Sales revenue].

Untitled3

Now we will try to calculate total Sales revenue for Austin in 2004 but in two steps.

Where and If

Define variables as:

[Sales Austin] =[Sales revenue] Where([City]=”Austin”)

[Sales Austin 2004] =Sum(If [Year]=”2004″ Then [Sales Austin])

The expected value for [Sales Austin 2004] is 561123.

But

1) The value calculated in the Sum line for Sales Austin for some reason is 2805617 (which is 5 x Sales Austin 2004 = 5 x 561123).

2) The value calculated in the table on the right is 13498366 (Which is the total of all values in the column Sales Austin i.e. 5 x (561123 + 1003071 + 1135479) = 13498366).

Untitled

This was a result for BO3.1 SP7. In BO4.1 SP7, the result is slightly different, we will get #MULTIVALUE in the right table.

We can explicitly add [Year] to calculation context.

[Sales Austin 2004] =Sum((If [Year]=”2004″ Then [Sales Austin])ForEach([Year]))

This will fix the value in the right table, but not in the Sum line.

If we explicitly add [Year] and remove [City], then the result will become correct.

[Sales Austin 2004] =Sum((If [Year]=”2004″ Then [Sales Austin])ForEach([Year])ForAll([City]))

or

[Sales Austin 2004] =Sum((If [Year]=”2004″ Then [Sales Austin])In([Year]))

So the calculation context in the variable [Sales Austin 2004] is derived incorrectly. Since we have [City] in the expression, it should have been included by BO. The variable [Sales Austin] has Where([City]=”Austin”), which removes [City] from context, so [City] should have been excluded. But for some reason, we have to specify this manually.

If

[Sales Austin] =If [City]=”Austin” Then [Sales revenue]

[Sales Austin 2004] =Sum(If [Year]=”2004″ Then [Sales Austin])

This works fine unless we add sum to [Sales Austin]:

[Sales Austin] =Sum(If [City]=”Austin” Then [Sales revenue])

[Sales Austin 2004] =Sum(If [Year]=”2004″ Then [Sales Austin])

In this case, the right table will show wrong value (13498366 in BO3 and #MULTIVALUE in BO4). We need to add [Year] to calculation context in [Sales Austin 2004].

Where

[Sales Austin] =[Sales revenue] Where ([City]=”Austin”)

[Sales Austin 2004] =[Sales Austin] Where ([Year]=”2004″)

The result will be correct if we use variable value [Sales Austin 2004] in Sum line. If we add Sum, the result in Sum line will become wrong 2805617.

You might also find it interesting that the following two formulas return different result

=Sum([Sales revenue] Where ([Year]=”2004″ And [City]=”Austin”))

=Sum([Sales revenue] Where ([Year]=”2004″)Where([City]=”Austin”))

The first is correct but the second will return 1683370. (I am not sure what this number is.)

How to edit merged dimensions in BO BI 4.x

In BO XI 3.1, to edit a merged dimension, we could right click on a merged dimension, and select “Edit merged dimension” from pop up menu, this would open a dialog for editing merged dimensions. This has changed in BI 4.x, and it might be not obvious how to adjust merged dimensions.

Add dimensions to a merged dimension:

Select the merged dimension and objects you want to add, click right button, select “Add to Merge”.

merge1

Remove dimensions from a merged dimension:

Select dimensions that you want to remove from merged dimensions, click right button, and select “Remove from Merge”

merge2

Referencing to a document’s block in OpenDocument link

When we use a OpenDocument link to open a Webi document, the report is displayed with a number of controls.

http://localhost:8080/OpenDocument/opendoc/openDocument.jsp?sType=wid&sIDType=CUID&iDocID=Aan15wubifNFikJjmlT.LVU

pic1


Sometimes we want to get rid of the controls and display only specific block (for instance, when it needs to be embedded into another application). This can be done with undocumented parameter sReportPart

The link will look like:

http://localhost:8080/OpenDocument/opendoc/openDocument.jsp?sType=wid&sIDType=CUID&iDocID=Aan15wubifNFikJjmlT.LVU&sReportPart=UIREF:RID=469:BID=473&mode=part

pic3

The tricky part is to find the ids: RID – Report id, and BID – Block id.

To find the IDs,

  • open the document in Web Intelligence Rich Client and save it as WID file
  • rename WID file to ZIP
  • unpack ZIP file
  • open file Data\RE\DOCSPEC
  • find necessary report element with RID attribute
  • find necessary block element with BID attribute

pic2

Weird merging issue in BO XI 3.1 SP5

SP3 FP5.3

Create a report that contains 3 objects: Country, Year, Revenue

Add table with expression

=Sum(If([Year] Between (“FY2004″;”FY2006”); [Revenue]; 0))

Add section by Country

Everything looks nice

Now add new query with only Year.

Now the expression produces null result. But why???

To see the numbers again, you can either unmerge Year (which is usually not an option)

or enable Extend merged dimension values

It is still not clear why this helps.

Difference between Where and If in Webi

Two expressions

=[Revenue] Where ([Country]=”US”)

and

=Sum(If [Country]=”US” Then [Revenue])

might look similar. They produce the same result if Country is not used in the table:

However with Country the result is slightly different

The expression with Where removes Country from the context, i.e. something like

=Sum(If [Country]=”US” Then [Revenue]) ForAll([Country])

Alerters & Drilling in Webi

It is not possible to use variables as drill object in Webi reports. Here is a clever trick how to overcome this limitation using alerters:

http://deltekbpm.blogspot.dk/2013/03/be-alert-part-1-to-drill-or-not-to-drill.html

The idea is to define a variable that calculates the drill level using the function DrillFilter() and then to use this variable in alerters to “overwrite” the value of the drill object with the value of the desired variable.

Join and Synchronization in Web Intelligence

When objects are merged in a Webi document there are two possible types of the merge operation: join and synchronization. The type depends on the objects selected in a data block. To achieve expectable result, it is important to understand the difference between these operations.

Let’s consider examples of each operation.

Join

The document use two data providers. The first data provider (Reservation) has Reservation Year, Future Revenue.

The second data provider (Sales) has Invoice Year, Sales Revenue.

The list of objects in the document contains these 4 objects:

Here are the corresponding tables in the report:

We cannot use both dimensions in the same data block. If we pick one, the other is grayed. The reason for that is that BO does not know how to combine the dimensions from different data providers. It is not obvious for BO that they have the same nature (year).

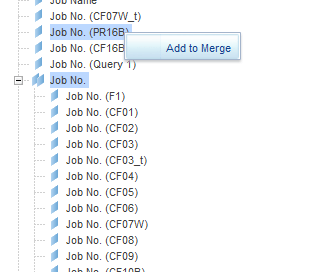
To tell BO that these dimensions have the same business meaning, and that we want to merge them in the report, we need to merge the dimensions.

We merge the Invoice Year and Reservation Year.

Now we can pick Year, Sales Revenue, Future Revenue in the same table.

The values of Year are the union of Invoice Year and Reservation Year values.

Note that if we pick only measure from one data provider, all years will be displayed.

Synchronization

Let’s add Sales Person to the second data provider:

The table has not changed:

If we add Sales Person to the table, there will be significant change than just adding one dimension:

  • Now the merged dimension is showing only values of Invoice Year.
  • Sales Revenue is also split by Sales Person.
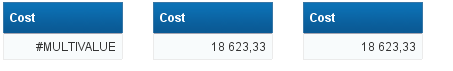
  • Future Revenue is also split by Sales Person. Instead the total Future Revenue for 2012 is shown for each Sales Person for 2012.

(Note that blank values here correspond to nulls. Null is just a normal value.)

The data in the two data providers has different granularity. It is not possible to calculate Future Revenue for a specific sales person as this granularity is not available in the Reservation data provider. Therefore BO shows total for 2012 for each Sales Person in 2012.

The years for which only Reservations exist are also not displayed. It is not possible to show them as the granularity of Reservations is lower than granularity of Sales. They cannot be added with blank in the column for Sales Person. Here the blank value means that there is no sales person. But sales person is just not relevant for Reservations. (OK, in general the sales person is relevant to reservations, but according to the data providers, he is not)

This demonstrates two types of operations: Join and Synchronization. The operation depends on the dimensions selected to the data block, it does not depend on measures and details.

Two data providers are joined if only merged dimensions are selected to the data block. All combinations of dimensions from the first data provider are united with all combinations of dimensions from the second data provider. The measures are projected in the context of the merged dimensions. The details are looked up by the matching dimensions.

Two data providers are synchronized if beside the merged dimensions, one or more non-merged dimension is used in the data block. All non-merged dimensions should be from the same data provider. Let’s call this data provider the leading data provider. All combinations of dimensions from the leading data provider are displayed in the data block. The measures from the secondary data provider are projected in context of dimensions from the secondary data provider and looked up by the matching merged dimensions.

(There can be more than two data providers involved)

Query

We considered two separate data providers. The operations join and synchronization are possible for a single data provider on a query level.

When we pick objects from the different contexts they are synchronized or joined on the query level.

For instance Future Revenue and Sales Revenue come from different contexts. Service is a common dimension (here, the common dimension is analogue of the merged dimension):

Therefore the queries are joined (note “Join” in the root):

The data provider with a joined queries acts as a data provider with a single query.

When beside the common dimensions, there is a dimension that does not belongs to all contexts, the queries are synchronized.

The synchronized queries are not actually synchronized when creating the data provider. The operation will be chosen by the dimensions selected in the data block. If only the common objects are used, the queries will be joined.

For instance, here you see result of the join operation, even though the synchronization operation was displayed for queries:


Hack of Webi prompts

Prompts can be used to select a value from the list of values. What about selecting a field from a list of fields? Say you have FIELD1 and FIELD2 in SOMETABLE. You want to display FIELD1 or FIELD2 depending on the user answer. You can write a long select using CASE WHEN, but that is not interesting. Here is a dirty hack 🙂

Create an object with select:

@Prompt('Select Dimension ', 'N', {'FIELD1', 'FIELD2'}, mono, constrained, persistent,)

Select SOMETABLE in the property Tables.

‘N’ is used as prompt type. This means that the values in the LoV are supposed to be numeric, so BO will unquote the selected value generating SQL.

Let’s try this in a report. Pick the object, and check the generated SQL:

When you run report, you will get a prompt:

You will see ‘foo’ in the report (which is the value of the field FIELD1)

The generated SQL: